Contents
Volatility in the cryptocurrency markets slid in January. The high to low range of bitcoin, the most liquid cryptocurrency, was $600. This was the narrowest range experienced in bitcoin since April of 2017. Traders have stepped to the side and appear to be waiting for a fundamental impetus to drive prices. Meanwhile, the ranges for Ethereum, ripple and dash were also subdued and all experienced low volatility during the first month of 2019. This compares to record volatility in nearly all cryptocurrencies just 1-year ago.
What Does the Decline in Volatility Mean?
When the volatility of an asset declines, it generally means that liquidity is moving out of that asset. When liquidity declines, the prices form a tight range and trade sideways. The sideways price action sends speculators to the sidelines further reducing the liquidity. When liquidity reaches its lowest point, the market has a chance to break out, generating higher volatility as speculators come rushing back in. During the first half of 2018, liquidity was higher and so was volatility. Many speculators in bitcoin, Ethereum, ripple and dash have exited their positions and are waiting for volatility to pick up.
Liquidity Has Declined
Interest in bitcoin around the globe seemed to change in 2018 and is likely to remain stable in the early part of 2019. Countries with the most relative interest in searching for Bitcoin in 2018, included emerging countries such as Ghana and Nigeria. These emerging countries have replaced Australia and Singapore since 2017. The volume of trades has also declined significantly. Daily bitcoin transaction volume peaked at $38 billion dollars in early 2018 and dropped 92% to around $3 billion dollars in January of 2019. Even the liquidity in BTC/ETH trading is slow.
Technicals
Bitcoin
The trend in bitcoin is downward and prices are testing the lows made in December of 2018. Short term momentum is negative as the fast stochastic recently generated a crossover sell signal. Medium term momentum is neutral as the MACD (moving average convergence divergence histogram is printing near the zero-index level with a flat trajectory which points to consolidation.

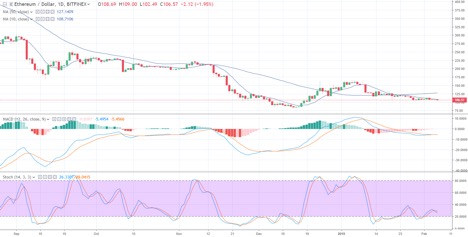
Ethereum
Ethereum is forming a bottom and testing the lows made in December of 2018. Short term momentum is negative as the fast stochastic recently generated a crossover sell signal. Medium term momentum is neutral as the MACD (moving average convergence divergence histogram is printing near the zero-index level with a flat trajectory which points to consolidation.
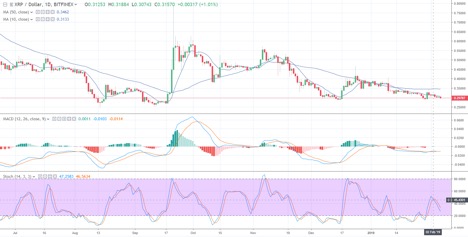
Ripple
Ripple is testing lows seen in January and December. Medium term momentum is neutral as the MACD (moving average convergence divergence histogram is printing near the zero-index level with a flat trajectory which points to consolidation. Short term momentum is negative as the fast stochastic recently generated a crossover sell signal.
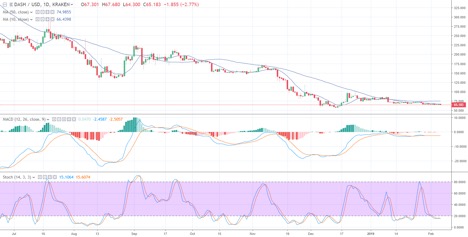
 Dash
Dash
 Dash
DashDash is trading sideways testing lows seen in January and December. Medium term momentum is neutral as the MACD (moving average convergence divergence histogram is printing near the zero-index level with a flat trajectory which points to consolidation. Short term momentum is negative as the fast stochastic recently generated a crossover sell signal.